Automated Data Quality Monitoring System
An automated platform for continuously validating data, detecting anomalies and schema drift, managing remediation workflows and monitoring data-quality SLAs.
- Role
Sole author — rule engine, drift checks, dashboard and API
- What it does
Validates warehouse tables against YAML rules, then tracks drift, SLAs and remediation.
- Built with
- Python
- pandas
- PostgreSQL
- SQLAlchemy
- Streamlit
- FastAPI
- Next.js
- Apache Airflow
- Docker
Overview
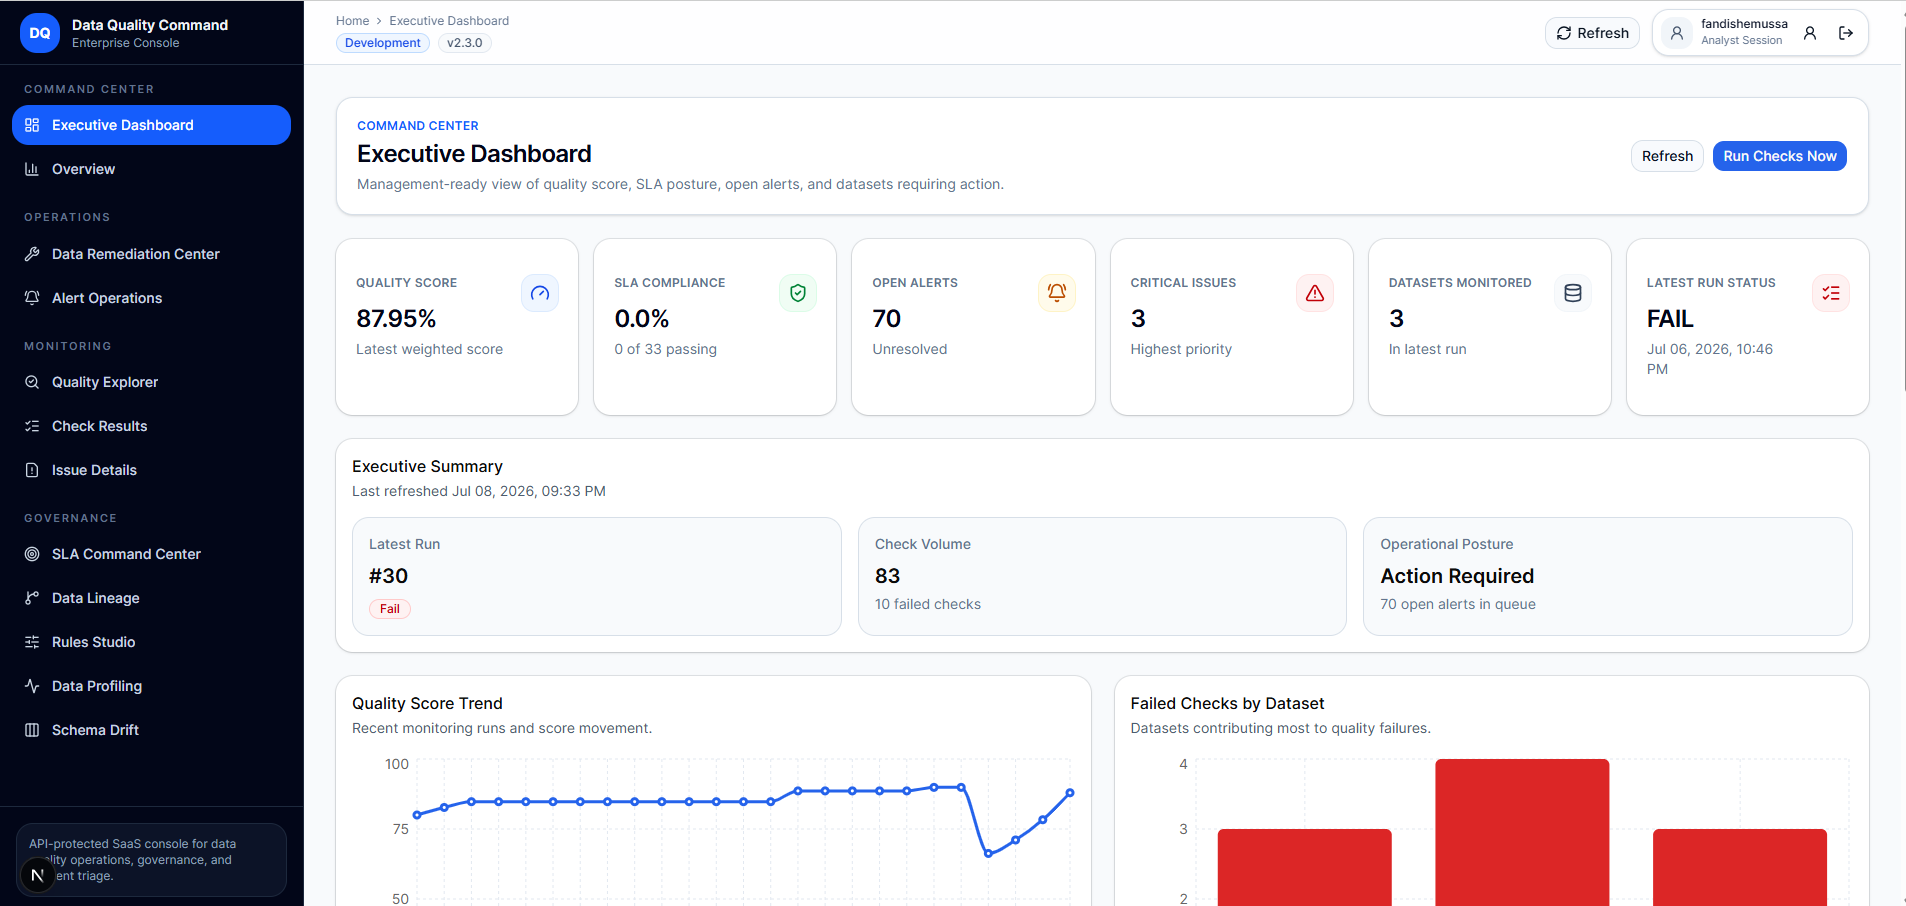
The system validates PostgreSQL and Amazon Redshift tables against quality rules declared in YAML, so a new check is a configuration change rather than a code change. Checks cover completeness, uniqueness, validity, freshness, consistency and range accuracy, and every run is written to monitoring tables with the failing rows attached for root-cause analysis. Alongside the rule engine it profiles columns, watches for schema drift and row-volume anomalies, compares distributions against a stored profile using mean, standard deviation and PSI, and scores each dataset against its SLA target. Failures become owned alerts that can be assigned, escalated and resolved, with delivery to Slack, Microsoft Teams or email. Remediation runs preview-first: a cleaning job shows its before-and-after change set for approval and records an audit trail. Results are read through a Streamlit dashboard, an optional FastAPI service under /api/v1, and a Next.js console.
What it does
- Config-driven quality rules in YAML, covering completeness, uniqueness, validity, freshness, consistency and range accuracy
- Failed-row issue details captured for root-cause analysis
- Profile-based drift monitoring using mean, standard deviation, PSI and category distribution
- Schema drift detection for added, removed, reordered and changed columns
- Historical SLA tracking and quality scoring per dataset
- Owned alerts with assignment, escalation and Slack, Teams or email delivery
- Preview-first remediation workflow with approval, change history and audit log
- Streamlit dashboard, optional FastAPI service and a Next.js console
Interface
Captures from the project's own repository.
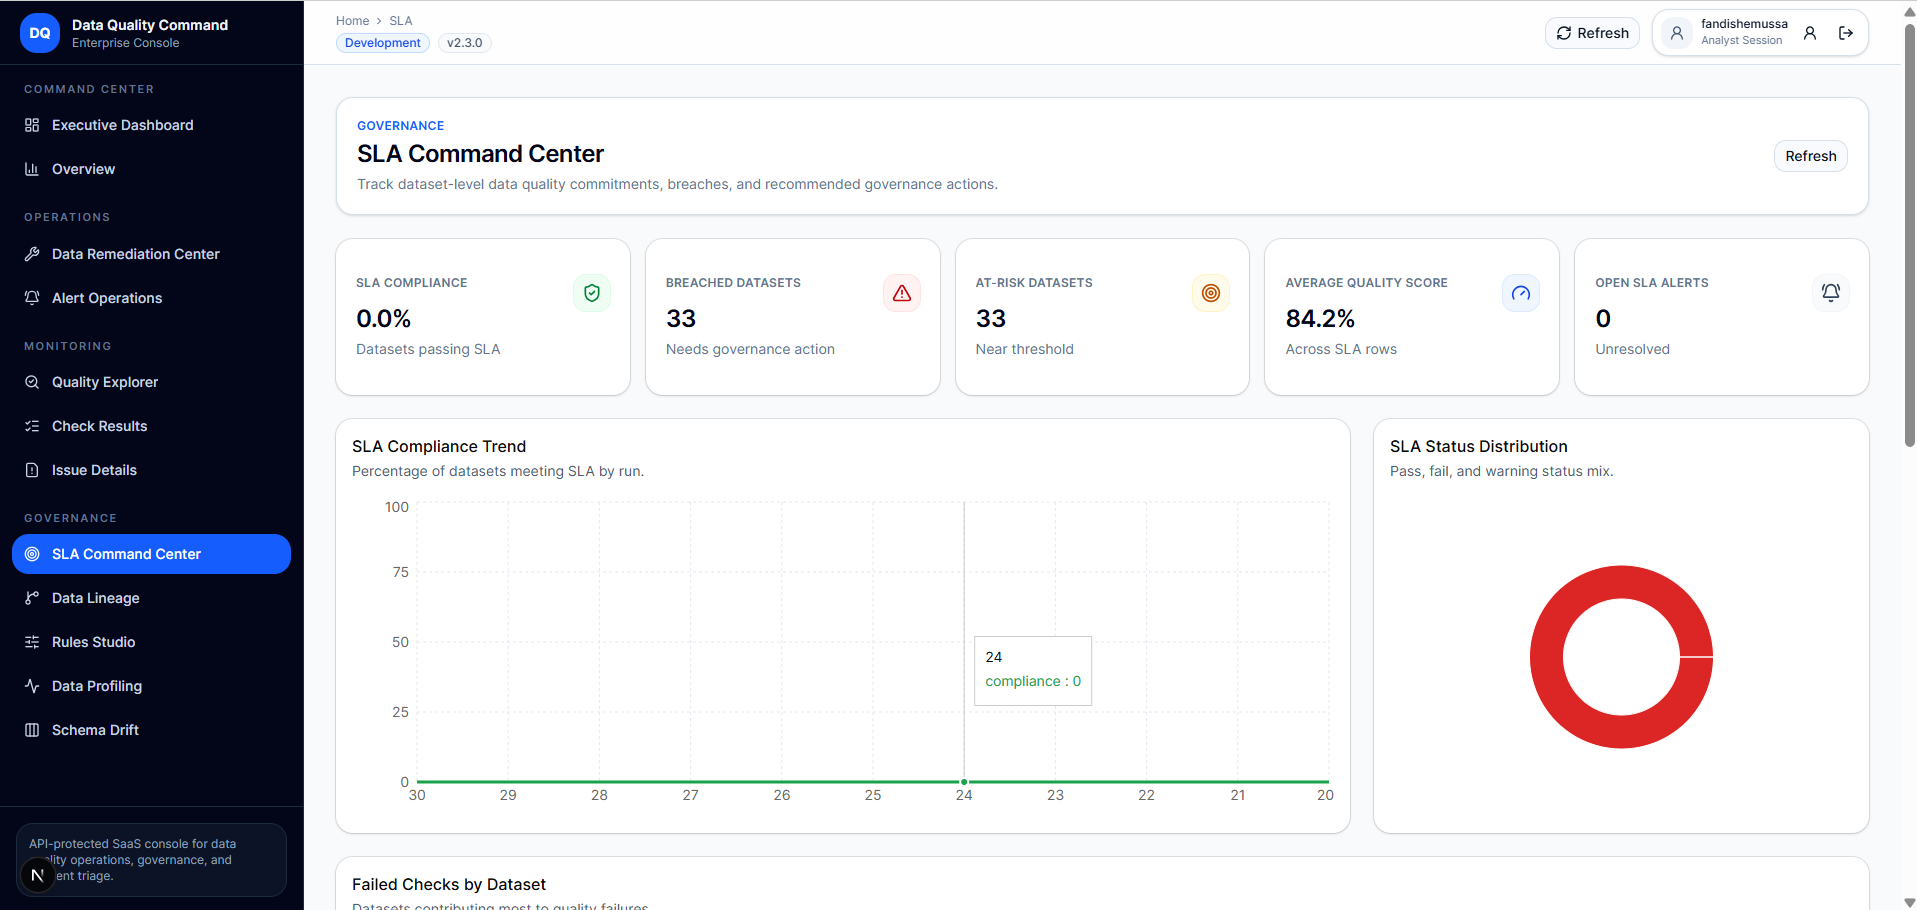
SLA Command Center 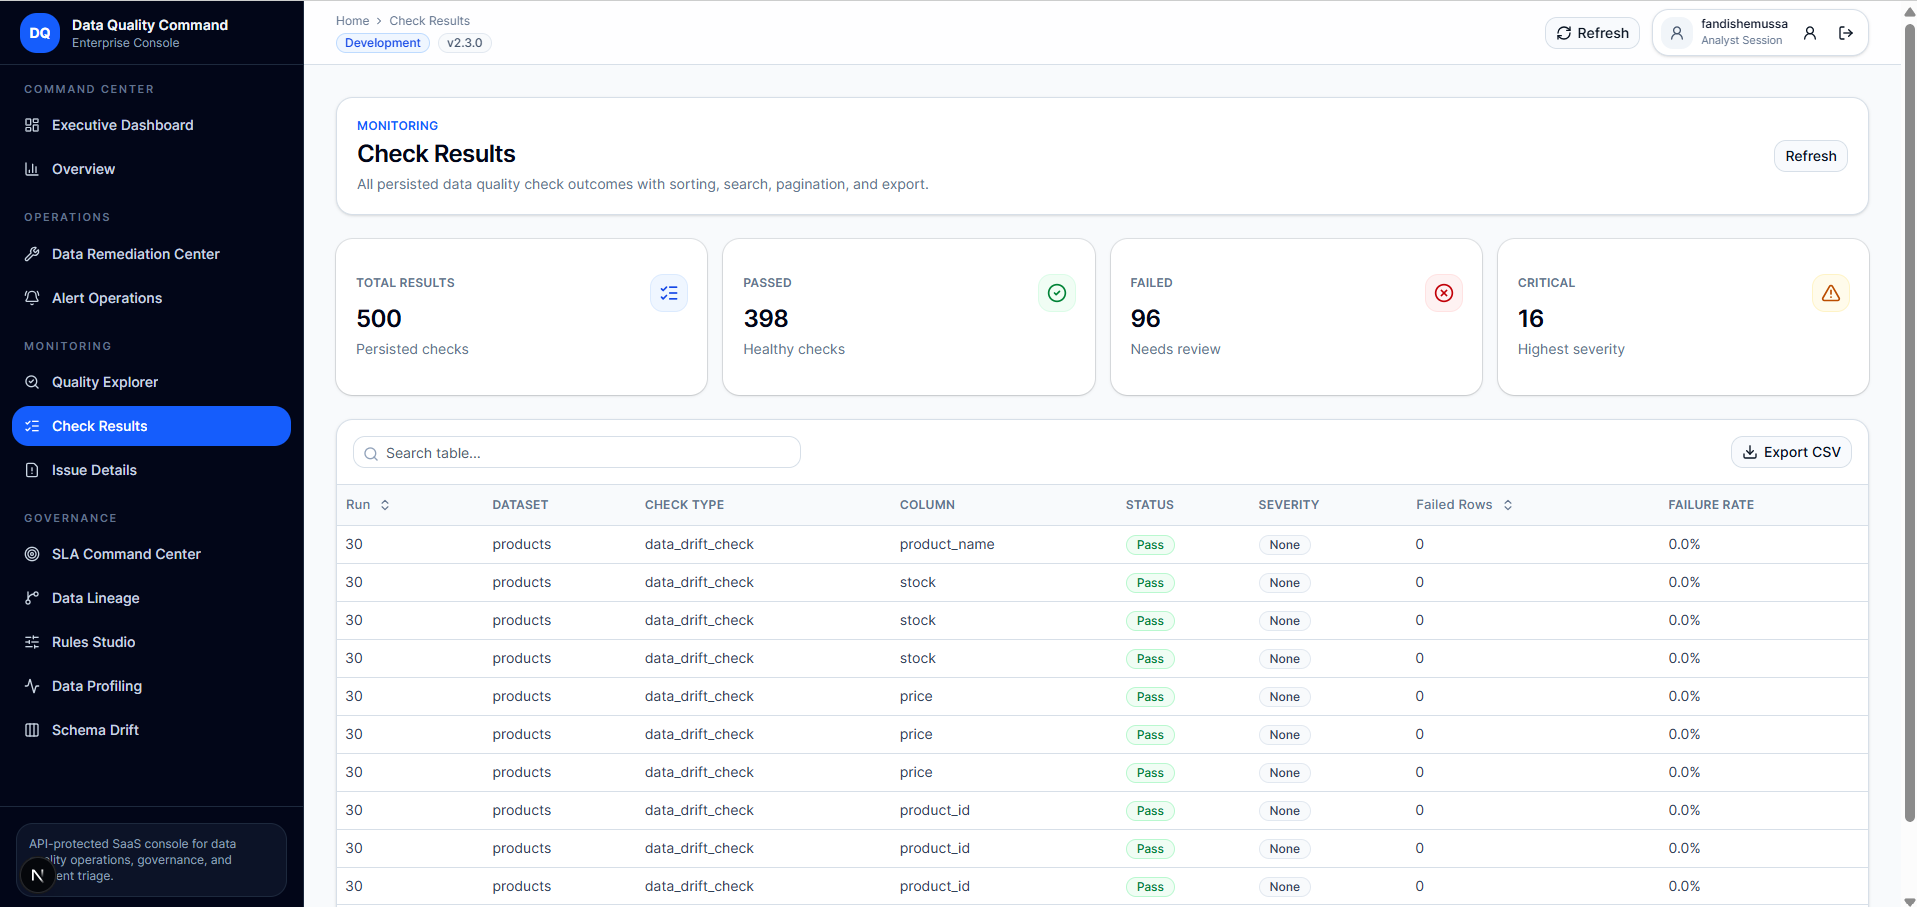
Check results 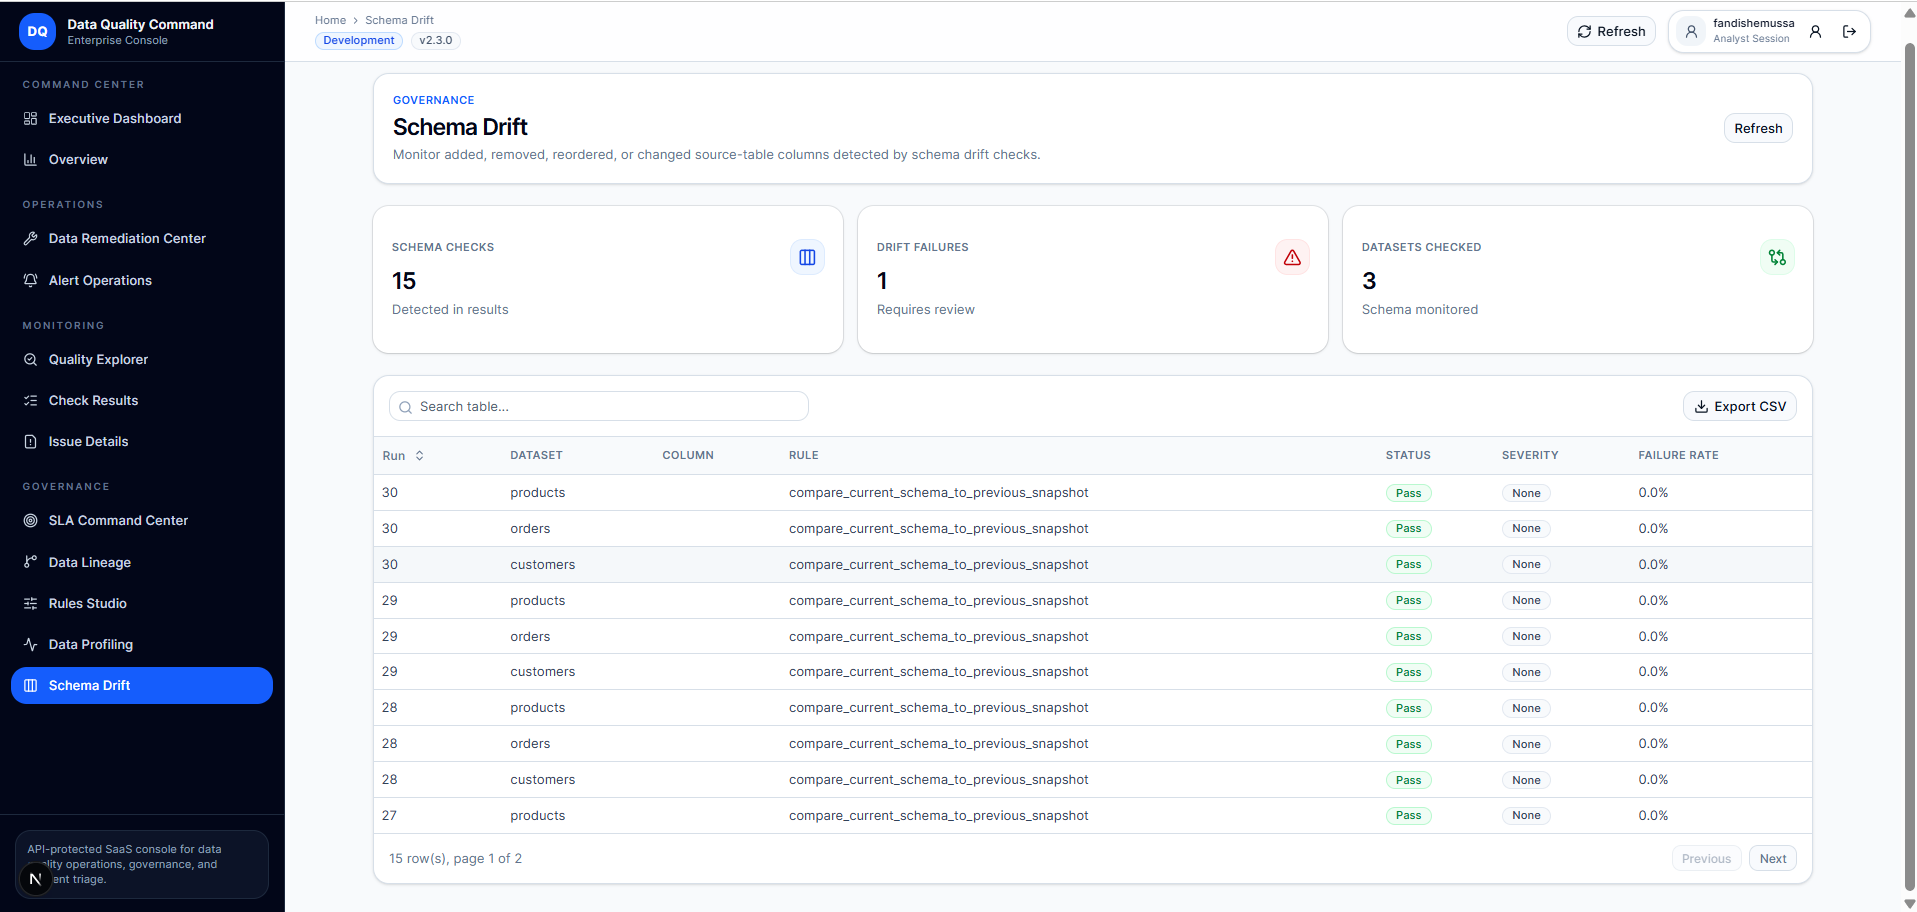
Schema drift 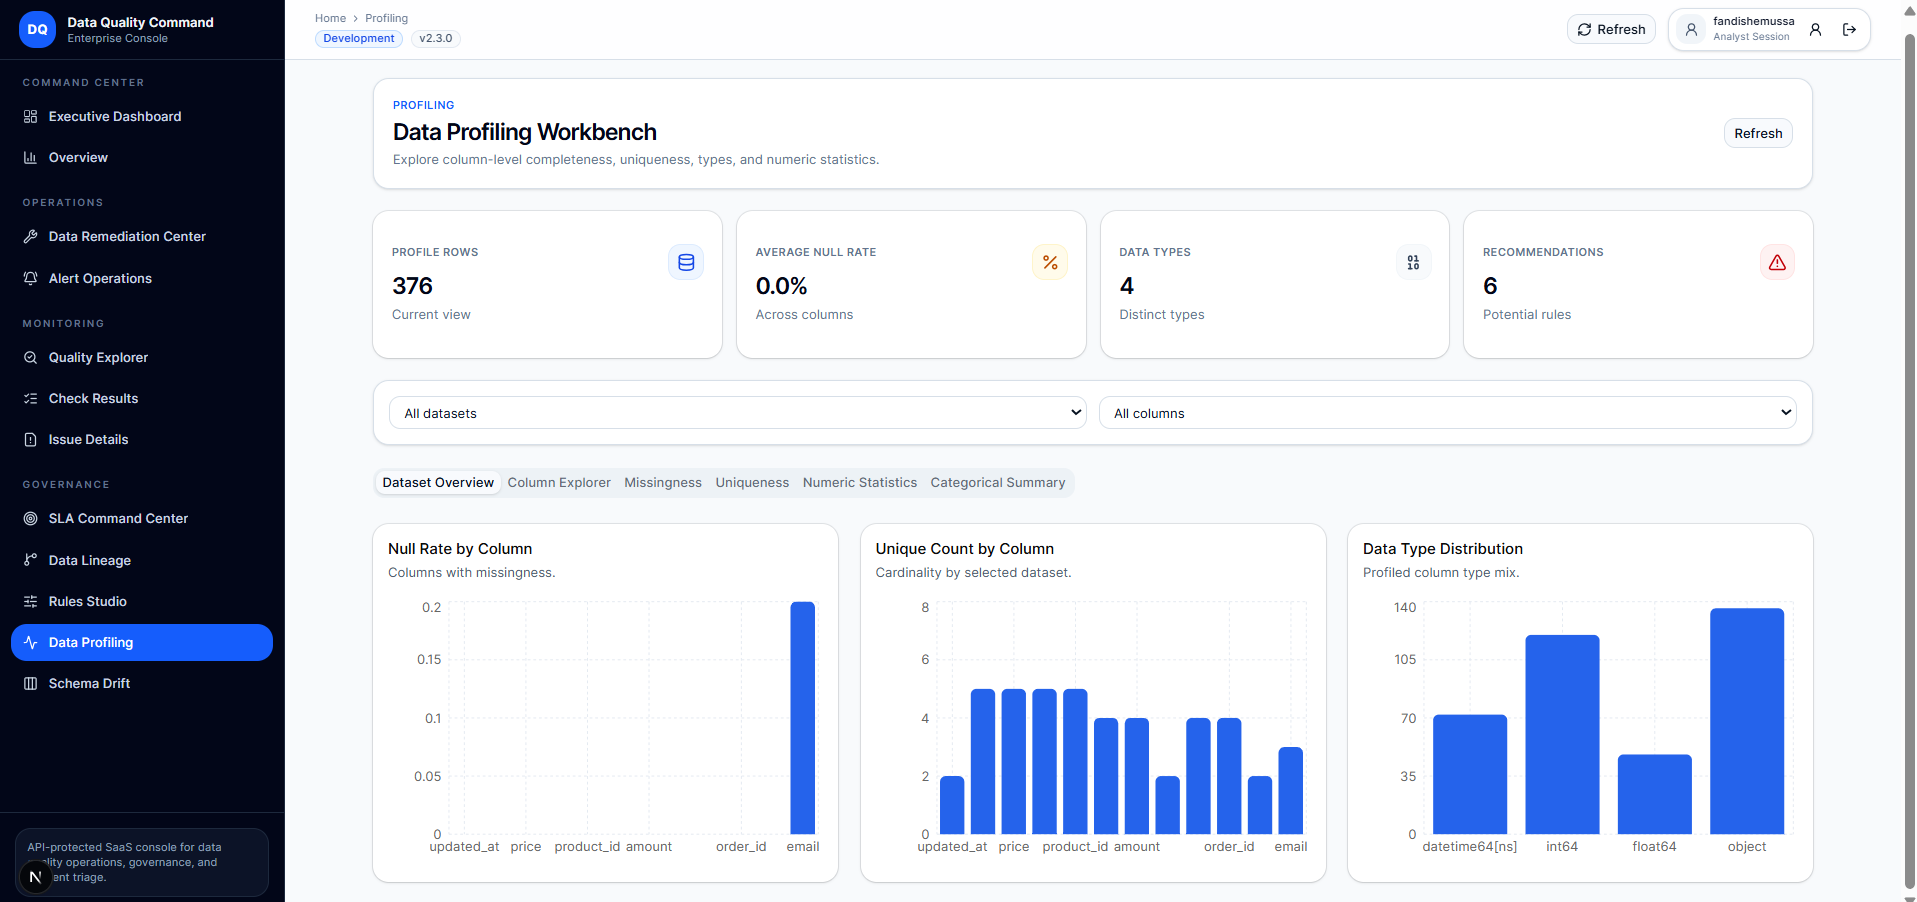
Data profiling 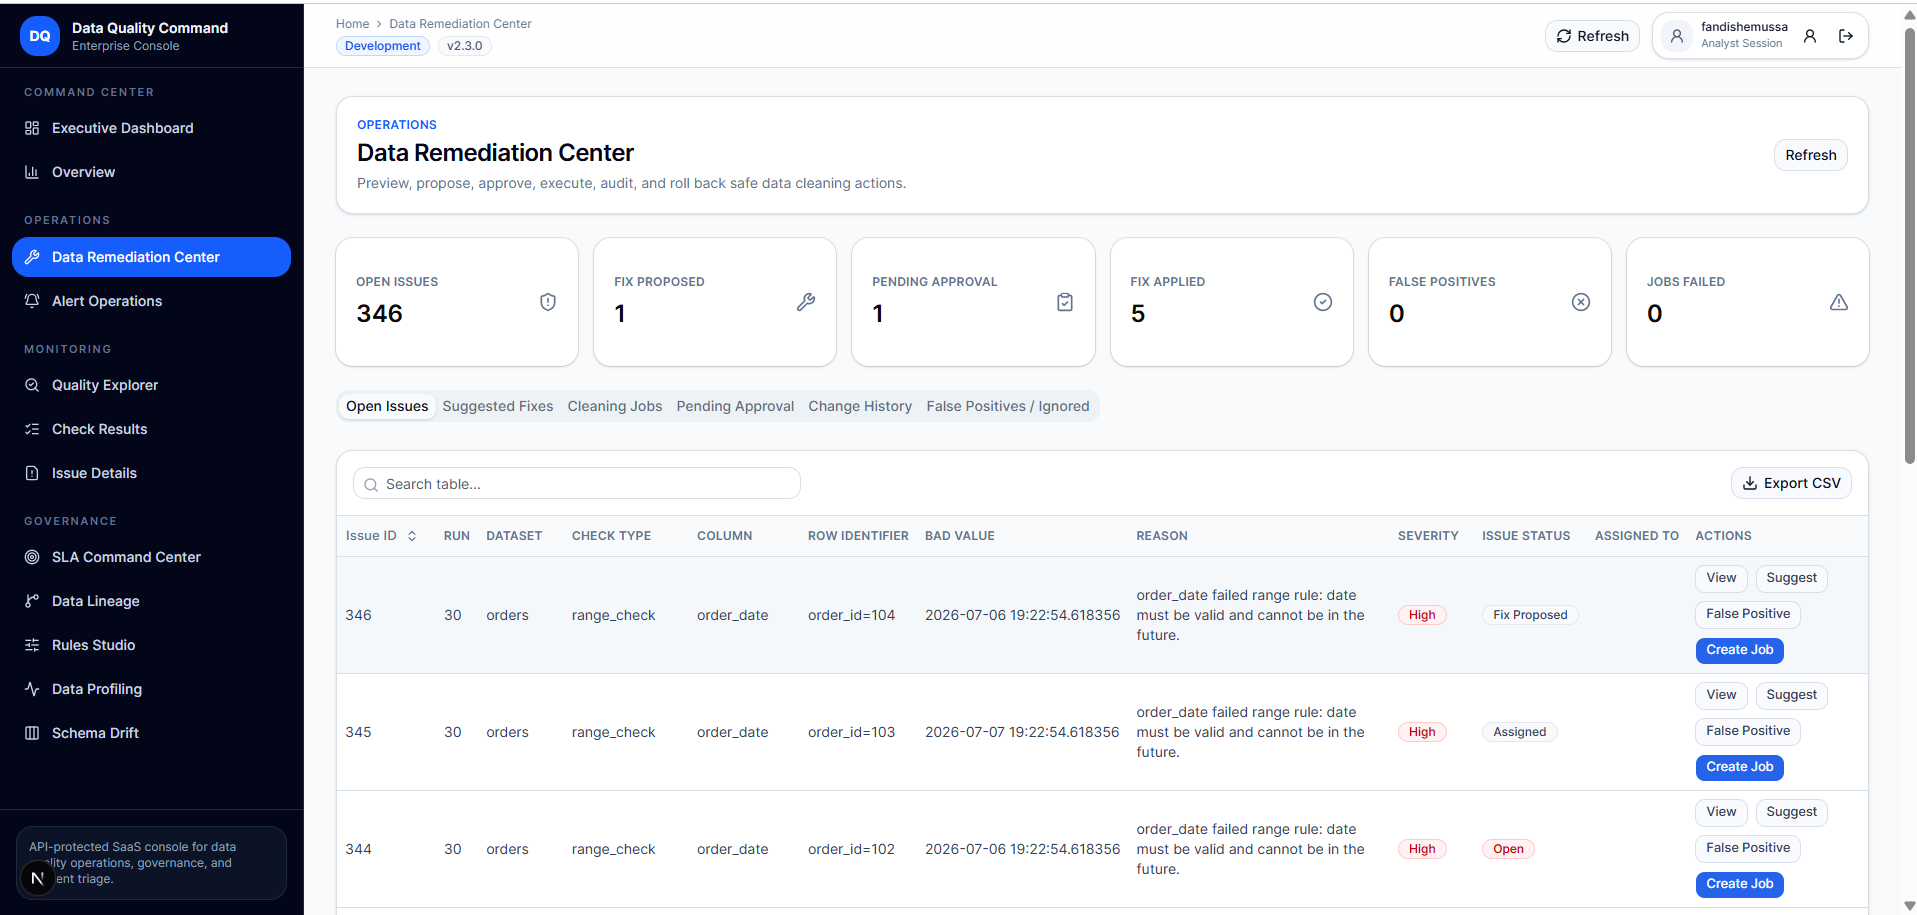
Data Remediation Center 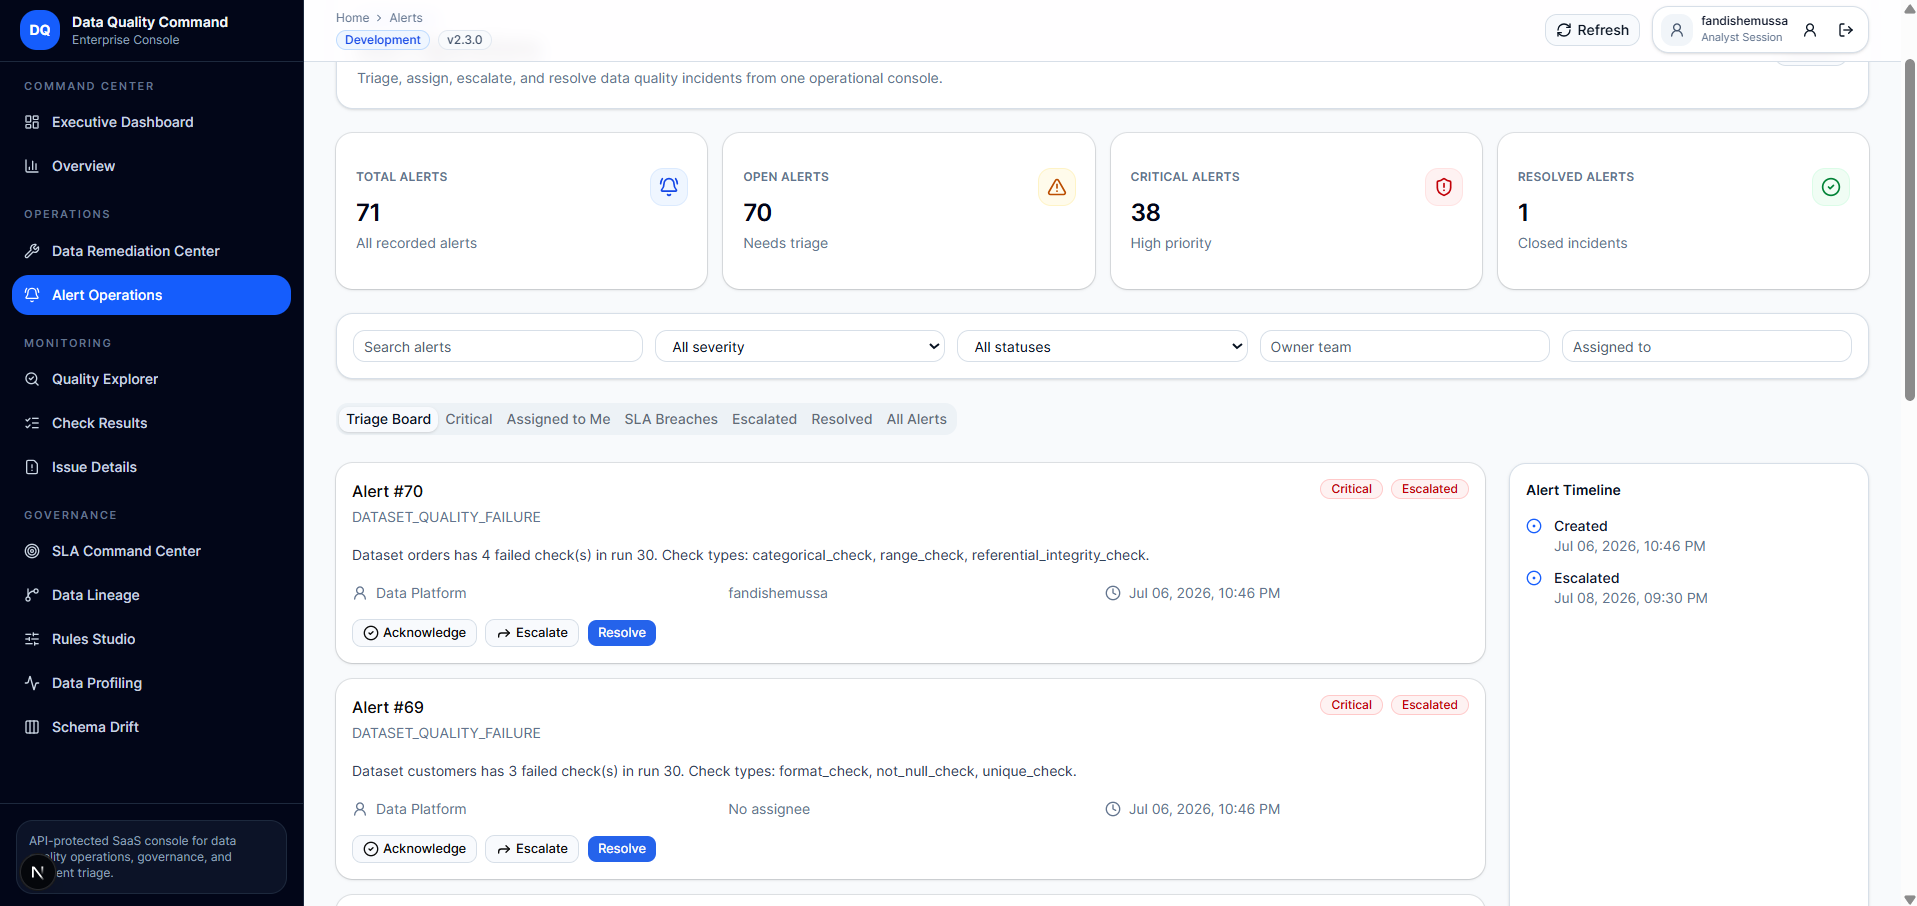
Alert operations
Want the detail behind this? Ask me about it.